The concept of a Retirement Index is not new. There are several measures of financial readiness for retirement, both on a broad national level as well as at a more segmented level. Some well-known national indices include the National Retirement Risk Index by Boston College, the International Retirement Security Survey by AARP and the Retirement Confidence Survey by the Employee Benefit Research Institute. Retirement indices focusing on more specific segments of the population include New York Life’s Across Generations Retirement Income Survey, the Retirement Preparedness Survey by Merrill Lynch and the Fidelity Retirement Index by Fidelity.
While these are only a sample of retirement indices currently available, all these measures have some of the following limitations:
- They are not based on national US data
- They only capture the pure economics in tracking retirement quality and do not capture non-economic factors like the impact of improved health, job flexibility and job quality, retirement planning and level of job adaptability at retirement. As a consequence, these retirement indices are directly correlated with the current state of the economy and tend to portray a negative image of retirement readiness during adverse economic times which could be misleading.
- Updates are done relatively infrequently
The Goldenson Center’s National Retirement Sustainability Index or NRSI attempts to overcome the limitations of current retirement indices by incorporating the following attributes:
- It captures both economic and non-economic drivers of retirement preparedness into a single measure which ranges from 0 to 100, where the higher the measure, the greater the sustainability at retirement.
- It will be updated annually
- It is based on publicly available US Census data and other nationally recognized data sources
- It provides logical and consistent values and it is academically rigorous
- It is simple to describe and interpret and make comparisons of retirement sustainability between different sectors of the population and over time
- Unlike current indices, the NRSI can be controlled, managed and improved by individual actions, thus allowing opportunities for providers of retirement products and services to proactively help individuals and the community as a whole achieve retirement sustainability in the future.
The NRSI comprises of two parts:
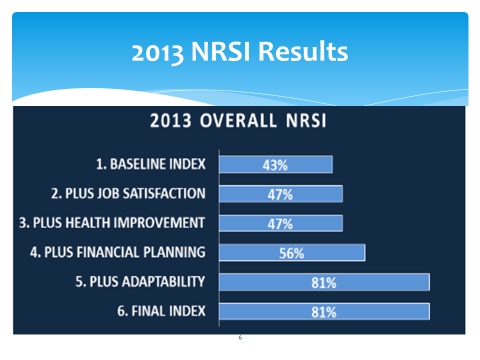
- The baseline NRSI which follows a similar logic to current indices and is calculated using purely economic drivers. The baseline NRSI projects accumulated assets available at retirement and compares it with estimated assets needed to meet all financial obligations at retirement. If projected assets at retirement are less than required assets, it represents a shortfall in retirement sustainability.
- The final NRSI which is the baseline NRSI adjusted to include various non-economic drivers of retirement sustainability. They are:
> Health status at retirement
> Level of job satisfaction
> Level of financial planning
> Level of adaptability which reflects the potential of the retiree to continue to generate part-time income during retirementAll these non-economic drivers are quantified in an objective, logical and academically rigorous manner as possible and have been calculated using publicly available US Census data and other nationally recognized data sources.
An NRSI of 50% can be interpreted to mean that in order to achieve retirement sustainability or readiness, one’s standard of living at retirement should be reduced to half of what it used to be just prior to retirement. The higher the NRSI, the closer retirement living standards are relative to living standards prior to retirement.
The NRSI can also be used to compare retirement sustainability between groups at a given time period or for the same group across time. For example, an increase in the NRSI from 50 to 55 over a given time period should be interpreted as a 10% improvement in the level of retirement living standards over the time period.
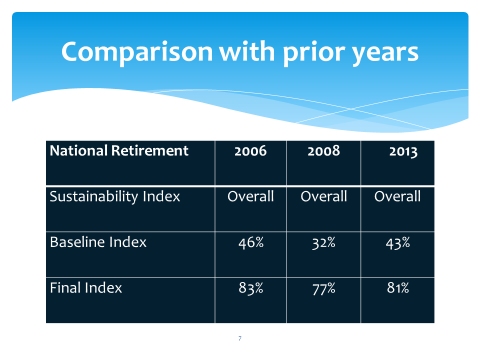
The main results are shown in the tables below for the current year, 2013, and two prior years, 2008 and 2006, to demonstrate how the NRSI changes as economic conditions change.


Leave a Reply